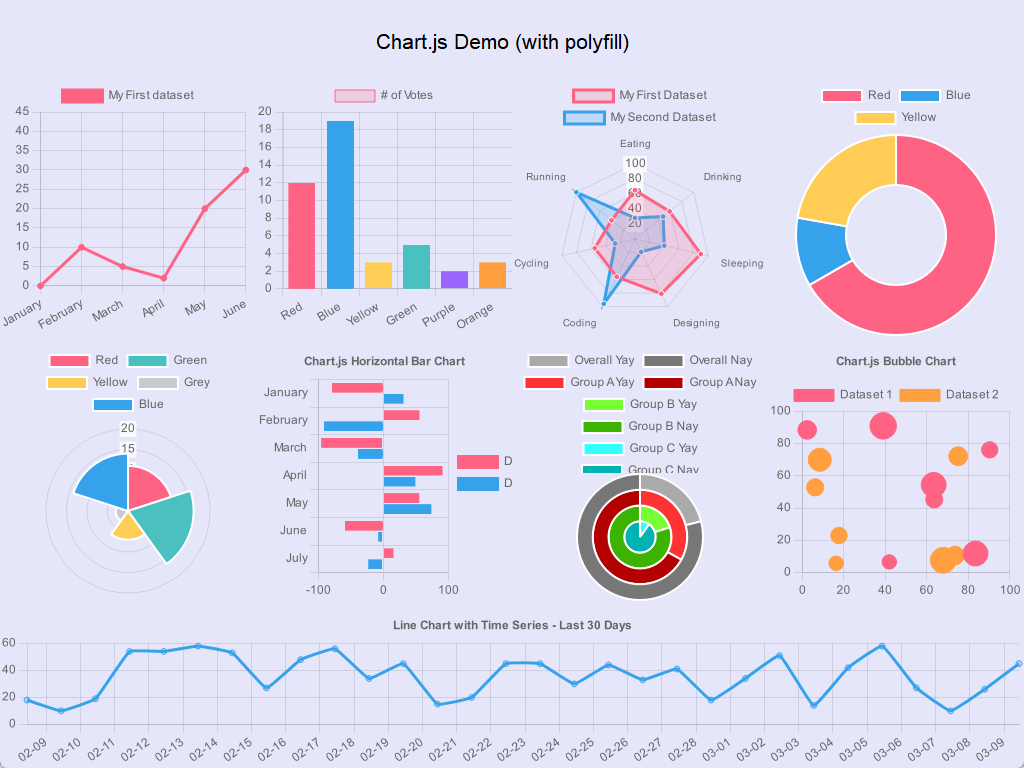
Chart.js is a flexible charting library using HTML5 canvas, which is supported by EBPro's JS Object. With the help of a helper class, we can use Chart.js to draw different charts in EBPro.
In this demo, we polyfill Canvas class of JS Object with proper properties so we can use Chart.js to draw different charts we need.
The demo can be downloaded at: jsobject-chartjs-20260306.cmtp
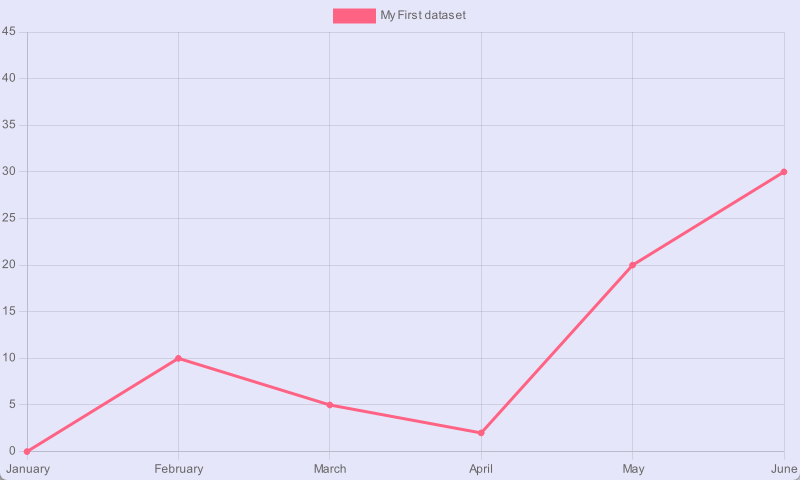
Simple line chart example
Step 1. Download Chart.js library and its date adapter if you want to use time scale in your charts. We have prepared the files for you:
- chartjs-v4.4.1.umd.min.js (Chart.js library)
- chartjs-ebpro-helper.js (helper class to wrap EBPro Canvas for Chart.js)
- chartjs-adapter-date-fns-v3.0.0.min.js (date adapter for Chart.js, optional, only needed when you want to use time scale in your charts)
Step 2. Open EasyBuilder Pro and create a new project if needed.
Step 3. Import downloaded files from Step 1 into [JS Resource]
Step 4. Create a new JS Object:
const chartjs = require('./chartjs-v4.4.1.umd.min.js');
const chartjsHelper = require('./chartjs-ebpro-helper.js');

// Wrap EBPro Canvas with helper functions to be used with Chart.js
var ctx = new chartjsHelper.CanvasWrapper();
this.widget.add(ctx);

// chartjs
const lineChart = new chartjs.Chart(ctx, {
    type: 'line',
    data: {
        labels: [
            'January',
            'February',
            'March',
            'April',
            'May',
            'June',
        ],
        datasets: [{
            label: 'My First dataset',
            backgroundColor: 'rgb(255, 99, 132)',
            borderColor: 'rgb(255, 99, 132)',
            data: [0, 10, 5, 2, 20, 30, 45],
        }]
    },
    options: {}
});
Step 5. Run the project and you should see a line chart displayed on the screen. You can modify the chart type, data, and options to create different charts as needed.
The project can also be downloaded at: demo-0-simple-line.cmtp
Other examples
- Line chart: demo-1-line.js
- Bar chart: demo-2-bar.js
- Radar chart: demo-3-radar.js
- Doughnut chart: demo-4-doughnut.js
- Polar chart: demo-5-polar.js
- Horizontal chart: demo-6-horizontal.js
- Pie chart: demo-7-pie.js
- Bubble chart: demo-8-bubble.js
- Timeseries chart: demo-9-timeseries.js